
I run a $90M+ manufacturing profit center.

Nicholas Kadunce · Plant Manager, Jennmar · Reedsville, West Virginia

~100
people · 7 direct reports
6 plants
run our operating system
Mondays
division executive review
$900K
2026 capital plan, funded
Contents
  1. Scope
  2. Year one
  3. Six plants
  4. People
  5. In print
  6. Exhibits
  7. Career
  8. Contact

Scope

What I am accountable for.

Accountable for safety, quality, delivery, cost, working capital, the capital plan, and about a hundred people. Jennmar is a $1B+ global manufacturer of ground-control products for mining and tunneling, privately held and private-equity-backed. Reedsville makes roof bolts, cable bolts, plates, mats, and discs for underground mines in soft and hard rock. About 80 SKUs across 11 processes on 27 production assets, two shifts, five days. Demand follows mining cycles and roof conditions, so winters run heavier.

The P&L

Reedsville is a profit center with its own revenue recognition. Revenue, materials, labor, freight, operating expense, and SG&A sit with the plant. Capital is proposed annually and approved above the plant; the 2026 plan was funded.

Customers and demand

Sales owns the customer relationship. The plant is measured on delivering what sales brings in, so S&OPSales and operations planning: the monthly process that lines up demand, capacity, staffing, and inventory. is mine. I join the VP of Operations and the sales team for onboarding visits with new mining customers. Out of that came the plant's first sales budget, seasonality in the forecast, and slow-moving stock worked down with sales.

Supply and spend

Purchasing issues the orders and sets terms. The plant decides what to order, when, and which critical spares to hold. On project work I negotiate scope and price, with two or more bids on larger purchases.

People

Seven direct reports: Superintendent (72 people), Maintenance Manager (12), Quality Manager (3), Dispatcher (3), Safety Manager, HR and Payroll Specialist, Inventory Control. Ninety hourly, ten salaried. Hiring authority for every role. New operators join through the company's services division for 90 days before going full-time.

Safety and environment

Safety runs on leading indicators: layered audits, near-miss reporting, guarding that removes the hazard, dust collection. No citations. I am accountable for the plant's stormwater and waste permits, with primary and secondary containment added and no notices of violation.

Operating cadence

Forums
WhenWhatWho
Every morningDaily Operations Review arrives by emailPlant leadership
Every MondayOperations reviewDivision president, CFO, CPO, general counsel, VP of Sales, other division presidents
Every two weeksPlant managers groupVP of Operations and the four plant managers
Every yearCapital submission; annual managers meetingVP of Operations; executive team
Five numbers I read every day, and the P&L line each one moves
NumberP&L line
Safety observations opened and closedWorkers' compensation and insurance cost
Daily deliveries to budget, month-to-date net incomeRevenue and earnings
Overall equipment effectiveness (OEE)Overtime, labor, and controllable operating expense
On-time deliveryRevenue retention and customer relationships
Days of inventory on hand and valuationWorking capital and SG&A

Headcount planning uses the sales projection and OEEOverall equipment effectiveness: availability × performance × quality, the share of planned time that produced good parts at rate. to set the lowest-cost staffing that meets demand. I own S&OP; the superintendent owns the production schedule.

I am one of four plant managers under the VP of Operations. The VP reports to the division president, who reports to the CEO.

Year one at Reedsville

What I was handed, and what changed.

The seat was open when I arrived in January 2025. The plant had customer orders, ISO 9001 registration, and a family culture worth keeping.

Delivery targets, downtime and defect tracking, a production schedule, supervisor standard work, and a way to measure OEE still had to be built. Leadership asked for a KPI system the executive team could see, improvement against it, and a start on lean.

These are the plant's numbers, delivered by about a hundred people.

60%+
cut in recordable injury rate · DARTDays away, restricted, or transferred: the rate of injuries serious enough to change someone's work. to zero
99%
on-time delivery, from 97% · 5-day lead time held
−15%
cost per ton, despite inflation
−27%
inventory · more than $3M of working capital released
Delivery
HandedCustomer orders · delivery targets not yet set · no plant sales budget
ChangedThe plant's first sales budget · on-time delivery 97% → 99% at a held 5-day lead time · shipments +2.1%, about $2M
Visibility
HandedDowntime and defects not yet tracked · OEE not yet measurable
ChangedDaily Operations Review, automated: safety, machine availability, inventory, sales to budget, quality, headcount, capex, lean · the same areas reviewed with the executive team every Monday
Output and labor
HandedFew work instructions · no production schedule · no supervisor standard work · tribal knowledge
ChangedOutput +3.2% · hourly headcount down about 7% in the first twelve months and about 10% to date · overtime down 6%, then 11% to date · supervisor standard work in place · staffing set by a headcount model (sales projection and OEE to the lowest-cost crew)
Cost
HandedNo plant-level net-income forecast · results known at month end
ChangedFinancial Forecaster projects net income daily · cost per ton −15% despite inflation · operating income improved · about $250K a year in validated process savings
Maintenance
HandedOutdated PMs · spares unmanaged, so the backlog looked smaller than it was
ChangedCMMSComputerized maintenance management system: work orders, preventive maintenance schedules, and spares in one place. with planned maintenance, spares control, and maintenance analytics · corrective work orders 159 → 50 a month
Inventory
HandedA fixed material order every month regardless of demand · storage areas over capacity
ChangedMake-to-stock and make-to-order with min/max tied to demand · inventory −27%, more than $3M · days on handHow many days of demand the inventory on hand would cover. 80 → 65, on a path to 45 · slow-moving stock 2.2 → 0.3 days
Quality
HandedISO 9001 registered · defects recorded as scrap weight only
ChangedAutomated tensile test logs · SPCStatistical process control: control charts that separate normal variation from a real change. by heat number · Pareto · tagged quarantine · customer complaints to zero · scrap tonnage flat while output rose · adopted by every plant in the division
Safety
HandedSafety managed on lagging indicators · near-miss reporting light
ChangedGuarding that removes the hazard · dust collection · layered audits · near-miss reporting · recordable injury rate cut more than 60%, DART to zero · no citations
Capital
HandedAnnual capital need around $1.4M
Changed$0.9M · 2026 plan funded at $900K across four projects, led by a $750K forging-and-assembly cell with payback under 3 years

Twelve months later: each row shows where it started and where it is now.

Percentages and rates are the published form of these results. Exact figures stay inside the company.

Six plants

Built at one plant, in use at six.

Across all six plants, the division executive team follows sales to budget and open safety actions through the Daily Operations Review. The Reedsville team built it.

Most of what we built has been handed to IT, which owns it and is scaling it. That is the arrangement I wanted. Build the first version with the plant, prove it, hand it over, help the next plant stand it up.

A decision across plants

When Reedsville was running well over its sales budget and a sister plant had capacity to spare, I proposed moving volume there. The VP of Operations and I took the decision jointly. Both plants met budget. Reedsville's overtime fell from 92 to 82 hours per employee biweekly over four months and held after the volume came back. A separate equipment move to a sister plant saves $35K a year in freight.

Daily Operations Review

All six plants in the division

An automated daily email and dashboard: safety, machine availability, inventory, sales to budget, quality, headcount, capex, lean. Built with the plant team, demonstrated to the executive team, then stood up at each plant in person.
Financial Forecaster

All six plants in the division

Projects month-to-date net income every day from ERP spend and delivery data plus a labor estimate. Its charts land in the Daily Operations Review automatically. Plants see cost against budget during the month, not after it. The projection is within about 10% of the month-end actual today; daily labor data should bring that to 3 to 5%.

Quality governance

All six plants in the division

Automated tensile test logs, SPC by heat number, Pareto, and tagged quarantine, rolled out plant by plant. The same logs settled a product complaint. With engineering, we traced it to the customer's installation equipment over-torquing the product. Once corrected, the issue disappeared and the relationship strengthened.

6
plants running the Daily Operations Review and Financial Forecaster, rolled out in person from Reedsville
45 min
demo and Q&A at the annual managers meeting, with the executive team in the audience
Mid-month
the executive team asks what is being done about a miss, before the month closes

IT is now extending the system across the whole company, adding AI integration and live PLC connections. The Reedsville team keeps building the next version the same way, with the plant first.

Inside the plant

  • CMMS and planned maintenanceWork orders, spares control, PM program, maintenance analytics. Corrective work orders down 69%, owned by the Maintenance Manager.
  • Supervisor standard work and headcount modelDaily leader routines, and a staffing model that turns the sales projection and OEE into the crew the plant needs. Output up on about 10% fewer hourly roles, cumulative.
  • Production incentiveThe existing per-piece production incentive, with rates refined and administration automated. The plan pays for itself through productivity.

People and decisions

How I lead, and three things that happened.

The pattern has held at every plant. Walk the floor, find the constraint, build the system, develop the people, repeat. The lines below are from my article in Metals & Mining Review; the stories are from Reedsville.

  1. 01

    When people understand what matters most, why it matters and how their work contributes, they are much more likely to take ownership of the result.

    A target on a board is not a priority until the team knows what it means for the work in front of them.

  2. 02

    Data should make problems easier to see, not create more work to find them.

    I automate the flow of information so losses are visible without anyone assembling a report. Pareto and SPC point at the constraint; operators supply the context the data cannot.

  3. 03

    A problem that can quietly return was never really solved.

    The work is finished when the operation behaves differently because of what was learned, and the fix is built into the process.

  4. 04

    The fastest way to stop seeing problems is to make people afraid to bring them forward.

    Accountability starts with what happened and what needs to change, and it runs in both directions, so effort and problem-solving are recognized when things go well.

  5. 05

    The real test is whether the improvement continues when the spotlight moved somewhere else.

    The maintenance area at Messer still ran the same way months after I stopped visiting. The Reedsville systems were handed to IT on purpose, so they do not depend on me.

Succession

When I arrived, the plant ordered a fixed amount of material every month regardless of demand. The superintendent, nearly forty years with the company, had a reason: running short had always cost more than carrying extra. We split the SKUs into make-to-stock and make-to-order. We started with the low-risk make-to-order items, then set min/max levels tied to demand and on-hand stock for the rest. He came along with it.

When he retired, the production supervisor I had been developing stepped into the role as planned. Six months later inventory was down 27% and the storage areas were labeled, inside capacity, and safer.

Culture

I kept the family culture the plant already had. What changed was the reflex, from reacting to problems to preventing them. Most of the leadership team made that shift. A few did not, after ample time and conversation, and I changed those seats.

One I got wrong

During a two-month slowdown, order intake dropped about 20%, and I let headcount drift down without replacing the people who left. Orders came back to normal over three days. Within 48 hours we moved shifts from eight to nine hours and ran a few mandatory Saturdays. I told the VP of Operations on day two. We met every delivery commitment, and the cost was a sizable overtime bill. The swing was seasonal and sharper than usual, since roof conditions in the mines drive orders up in cold months. Seasonality is now built into the demand forecast, staffing plan, and inventory levels.

People

~25 hired · ~10 promoted
at Reedsville: operator to quality technician, team lead, maintenance, and junior dispatcher; supervisor to superintendent
~100 hired · 8 promoted
at Eos, including a 40-person third shift recruited and trained in two months that led the plant on OEE within a month
Where they went
production supervisors, team leaders, engineers, a batching manager, a washcoat engineer

New operators at Reedsville join through the company's services division for 90 days before becoming full-time. The local workforce is stable, and people stay.

In print

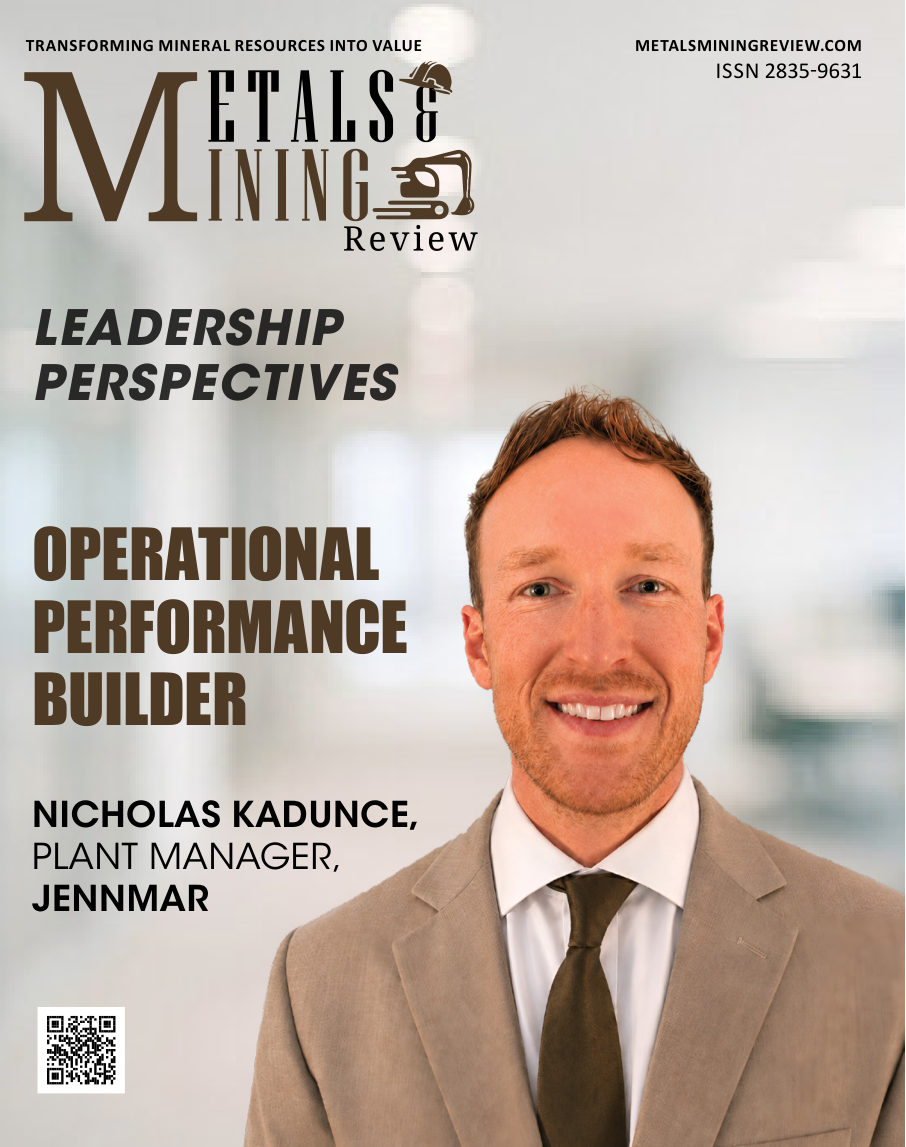
Metals & Mining Review, October 2026

Exhibits

Systems and projects, shown the way they were used.

Every exhibit recreates a real system or project with representative data. Live plant data stays inside the plant. Each one says who it was for, what it changed, and who owns it now. Process names are generic; the demo plant name is a placeholder.

Real system · representative data · built at Jennmar, in use at six plants

Daily Operations Review

Jennmar · 2025
Situation
No downtime, defect, or delivery data existed at the plant.
Audience
Plant leadership every morning; the division executive team, which follows sales to budget and open safety actions through it.
What it changed
How safety projects are chosen and shared across plants, how the direct and indirect headcount mix is set, and how planned maintenance is judged.
Owner today
IT, with the plant managers. Running in six plants.

Representative day under a placeholder plant name. The real report compiles itself each morning with minimal input and is the first thing the plant reads. OEE is availability × performance × quality.

Real system · representative data · built at Jennmar, in use at six plants

Financial Forecaster

Jennmar · 2025
Situation
Costs were known at month end, after decisions were already made.
Audience
Plant managers; the executive team, through the Daily Operations Review.
What it changed
Executives now ask mid-month what is driving a budget miss and what is being done about it.
Owner today
IT. Running in six plants.
Net income, month to dateProjectedBudget, cumulative
Month-to-date net income, projection, and cumulative budget by working day, indexed to 100 at month end
Working dayNet income, month to dateProjectedBudget, cumulative
13.94.5
28.89.1
313.913.6
417.618.2
522.922.7
628.427.3
732.031.8
835.136.4
940.640.9
1046.345.5
1151.250.0
1255.054.5
1360.459.1
1465.165.163.6
1569.868.2
1674.472.7
1779.177.3
1883.781.8
1988.486.4
2093.090.9
2197.795.5
22102.3100

Net income month to date, indexed so no revenue can be read from it, against the cumulative budget.

Daily
refresh from ERP spend and delivery data
± 10%
month-end variance today
± 3 to 5%
expected once daily labor actuals are connected

Representative month, indexed so no revenue can be read from it. The forecaster runs as a Python and Excel automation and its charts are inserted into the Daily Operations Review automatically.

Real plan · amounts as approved · Jennmar, 2026

2026 capital plan

Jennmar · 2025 submission
Situation
Annual capital need had been running around $1.4M.
Audience
VP of Operations, annual capital submission.
What it changed
Funded. $900K across four projects.
Owner today
Plant Manager.
  • Integrated forging-and-assembly cell · $750K · 83%
  • Reliability and infrastructure, three projects · about $150K · 17%
Annual capital need
Prior year$1.4M
2026$0.9M
$1.4M → $0.9M
annual capital need, before and after year one
4
projects, led by the automation cell

The three smaller projects are reliability and infrastructure work; their names stay inside the plant.

Real project · representative monthly figures · prepared for a CEO and COO plant visit

Automation cell business case

Jennmar · 2026
Situation
Forging and assembly ran as separate batch steps with handling between them.
Audience
CEO and COO plant visit.
What it changed
Approved as the largest item in the 2026 plan.
Owner today
Plant Manager, with engineering.
Process flow
Forging Assembly WIP Integrated forging-and-assembly cell 12.8 s per piece 7.0 s per piece two steps, handling between 2.5 fewer operators per shift
Cumulative cash position
Cumulative cash position by month, in thousands of dollars
MonthCumulative cash position, $K
0−750
6−615
12−480
18−345
24−210
30−75
3660
42195
48330

Today: forging and assembly run as separate steps with handling between them.

$750K
investment
12.8 → 7.0 s
cycle time per piece
2.5
fewer operators per shift
about $270K
savings per year, derived from the payback
Under 3 years
payback

Savings are derived from the payback the case was approved on; the cell is R&D-heavy and first of its kind in the company. Cycle time and operator figures are from the approved case.

Real result · representative mix · Jennmar, 2025

Inventory

Jennmar · 2025
Situation
A fixed material order every month regardless of demand; storage areas over capacity.
Audience
Superintendent, sales, inventory control.
What it changed
Split SKUs into make-to-stock and make-to-order with min/max tied to demand; work slow-moving stock down with sales.
Owner today
Inventory control and the superintendent.
Days on hand
Days of inventory on hand
PointDays on hand
Start80
Now65
Year-end target45

Eighty days of inventory on hand when I arrived, with storage areas over capacity.

Representative mix by class
  • Finished goods 50%
  • Raw material 35%
  • Work in process 15%
−27%
inventory value, more than $3M
80 → 65
days on hand, on a path to 45 by year end
2.2 → 0.3
slow-moving stock, days on hand

About 80 SKUs, roughly 40 of them made to stock. The mix is representative; the percentages and days are the real results. Six months in, the storage areas were labeled with min/max and overflow locations, inside capacity, and safer.

Real decision · representative monthly figures · Jennmar, 2025

Volume rebalancing

Jennmar · 2025
Situation
Reedsville was running well over its sales budget while a sister plant had capacity to spare.
Audience
VP of Operations.
What it changed
Offered volume to the sister plant for four months, then took it back at the lower overtime level.
Owner today
Plant Manager, with the VP of Operations.
Reedsville tons, % of budgetHours per employee, biweeklyVolume at the sister plant
Reedsville tons as a percent of budget and hours per employee, biweekly, by month
MonthTons, % of budgetHours per employee, biweeklyVolume at the sister plant
111292No
211092No
310082Yes
410082Yes
510182Yes
610082Yes
710881No
810982No

Reedsville running well over budget, overtime at 92 hours per employee biweekly.

92 → 82
hours per employee, biweekly
Both plants
on budget
Four months
then sustained

Both plants reached budget during the four months. When the volume came back, the hours held at 82.

Real project · representative data · Messer Americas, 2023

Krypton/Xenon production, proven in control

Messer Americas · 2023
Situation
Rare-gas output at an air separation plant; a year-long project.
Audience
Executive operations team (COO, VP, director, performance improvement team).
What it changed
Nothing to decide. The chart proved the gain was real and holding.
Owner today
None. The project closed with this chart as its record.
Baseline, days 1 to 30Implementation, days 31 to 44New level, days 45 to 74MeanControl limits
Daily output index with the mean and control limits in force on each day; the implementation period has no limits
DayOutput indexMeanLower limitUpper limit
110110082118
29410082118
310810082118
49710082118
510310082118
69110082118
710610082118
89910082118
911010082118
109510082118
1110210082118
128810082118
1310510082118
149810082118
1510710082118
169310082118
1710010082118
1810910082118
199610082118
2010410082118
219010082118
2210310082118
239910082118
2411110082118
259410082118
2610110082118
279710082118
2810610082118
299210082118
3010210082118
31118
3296
33124
3485
35112
36130
3792
38121
39104
40127
4198
42116
43110
44119
45114115110120
46117115110120
47115115110120
48113115110120
49116115110120
50118115110120
51114115110120
52115115110120
53112115110120
54117115110120
55116115110120
56113115110120
57115115110120
58118115110120
59114115110120
60116115110120
61115115110120
62113115110120
63117115110120
64115115110120
65114115110120
66116115110120
67118115110120
68115115110120
69113115110120
70116115110120
71114115110120
72117115110120
73115115110120
74116115110120

Thirty days of baseline: wide day-to-day variation around the old mean.

+15%
production
$1M+
annual revenue, validated by finance
Held
inside recalculated control limits

Representative values. Baseline output varied widely from day to day. Output swung as the change was implemented, then settled at a level 15% higher with far less variation and held inside recalculated control limits. The project also lowered hydrocarbon concentration risk in the process.

Every exhibit recreates a real system or project with representative data. Live plant data stays inside the plant.

Career

Four manufacturers, four situations.

JennmarReedsville, WVJanuary 2025 – Present

An open seat and an operating system to build.

Privately held, private-equity-backed global manufacturer of ground-control products for underground mining and tunneling, $1B+ revenue. Reedsville is the third-largest of six bolt plants in the division by revenue and headcount.

$90M+ P&L · about 100 people · 7 direct reports · about 25,000 tons a year across about 80 SKUs · 27 production assets · S&OP owner · reports to the VP of Operations

Plant Manager

  • Built the KPI system where none existed and made it visible to the executive team. Year one: operating income up · cost per ton −15% · inventory −27%, more than $3M of working capital released · on-time delivery 97% → 99% · recordable injury rate cut more than 60%, DART to zero.
  • With the plant team, built the Daily Operations Review, the Financial Forecaster, and quality governance by heat number, and led a CMMS rollout. Handed the platform to IT, which owns it and is extending it company-wide. The Review and Forecaster run in all six plants.
  • Won approval for the 2026 capital plan, $900K across four projects, led by a $750K forging-and-assembly cell with payback under 3 years. Annual capital need $1.4M to $0.9M.
  • About $250K a year in process savings validated by cost accountants, plus $25K negotiated on capital purchases.
  • Hired about 25 and promoted about 10, including the production supervisor who became superintendent as planned succession.
Eos Energy EnterprisesTurtle Creek, PADecember 2023 – December 2024

A public scale-up ramping against investor milestones.

Publicly traded US battery energy storage scale-up (zinc-based long-duration storage); 500 to 1,000 employees; three sites; revenue $16M in 2024 and $115M in 2025. UL-listed electrical products and corrosive electrolyte handling.

Operations Manager · June 2024 – December 2024

two production buildings · 11 supervisors and 6 team leads · 240 technicians at peak · reported to the Sr. Director of Operations · output presented daily to the executive team against investor milestones

  • Selected through a competitive process. The team met every investor performance milestone while I held the role, with no recordable injuries.
  • Company's first hour-by-hour production dashboards; module assembly time 46.5 to 20.5 minutes; subassembly rate up 41%, defects down 22%.
  • BESS output 0.5 to 2.2 units per day, a sustained average at process capacity; rework down 66%.
  • Recruited and trained a 40-person third shift in two months; hired about 100, promoted 8; sustained a 12-per-shift headcount reduction through subassembly automation; helped plan the 432,000 sq ft Thorn Hill facility.

Quality Engineer · December 2023 – June 2024

  • Built the quality program where none existed (defect codes, QMS, control plans, test protocols, internal audits toward ISO 9001). Wrote the specifications and test regimen for the next-generation Z3 module and BESS launch. Testing cycle time down about 60%, scrap defects down 30%; directed the daily work of 6 quality technicians.
Messer AmericasNortheast region (PA, WV, ME)October 2022 – December 2023

Four air separation plants in three states, supported from one.

Privately held industrial gas producer formed from the Linde and Praxair divestiture; Messer Group about 4.4 billion euros in revenue; 5,000 to 10,000 employees in the Americas.

four air separation plants, about 80 employees combined · $400K project and expense budget · regional engineering role with weekly site travel

Regional Production Engineer

  • Initiated and led the Krypton/Xenon production project: output up 15%, $1M+ annual revenue validated by finance, lower hydrocarbon concentration risk in the process. $1.1M in total validated project value.
  • 15+ reliability and capital projects; 25 fewer downtime days a year; lead times down about 30 days; about $20K in negotiated vendor savings.
  • Reorganized maintenance tools and spares at point of use with 5S and min/max by asset. The ideas came from the technicians. It was still running the same way months later without me.
  • 2022 EMBRACE Country Champion, Efficiency (United States).
Johnson MattheySmithfield, PASeptember 2020 – October 2022

A fully automated, high-mix line under strict chemical handling.

Global catalyst manufacturer headquartered in the UK; the plant made heavy-duty diesel catalytic converters on a fully automated, high-mix line with strict chemical handling.

Production Team Shift Leader II · March 2022 – October 2022

  • Acting supervisor for the shift. Plant OEE 76% to 81.2%; the plant recorded zero lost-time and recordable injuries in 2022.

Process Control Engineer · September 2020 – March 2022

  • Owned setups and optimization of the automated line; cycle time down 8%, defects down 4%; a setup-parameter library removed 35 hours of annual changeover downtime; $220K in savings validated by the CI manager.

Credentials

Certifications

  • Applied Agentic AI for Organizational TransformationMIT Professional EducationJul 2026
  • Lean Six Sigma Black Belt ProfessionalSix Sigma Global InstituteApr 2026
  • OSHA 30-HourJun 2025
  • Certified ScrumMaster (CSM)Scrum AllianceNov 2024
  • ISO 9001 Lead Auditor trainingExemplar GlobalFeb 2024

Recognition

  • Cover feature, Metals & Mining ReviewLeadership Perspectives, "Operational Performance Builder"; Certificate of Editorial RecognitionOct 2026
  • EMBRACE Country Champion, Efficiency (United States)Messer Americas, for 2022Mar 2023

Education

  • B.S., Chemical EngineeringWest Virginia University

Contact

Conversations are welcome.

I am glad to talk about manufacturing performance, the operating systems behind it, and how plants develop their own leaders. Email is the fastest way to reach me.