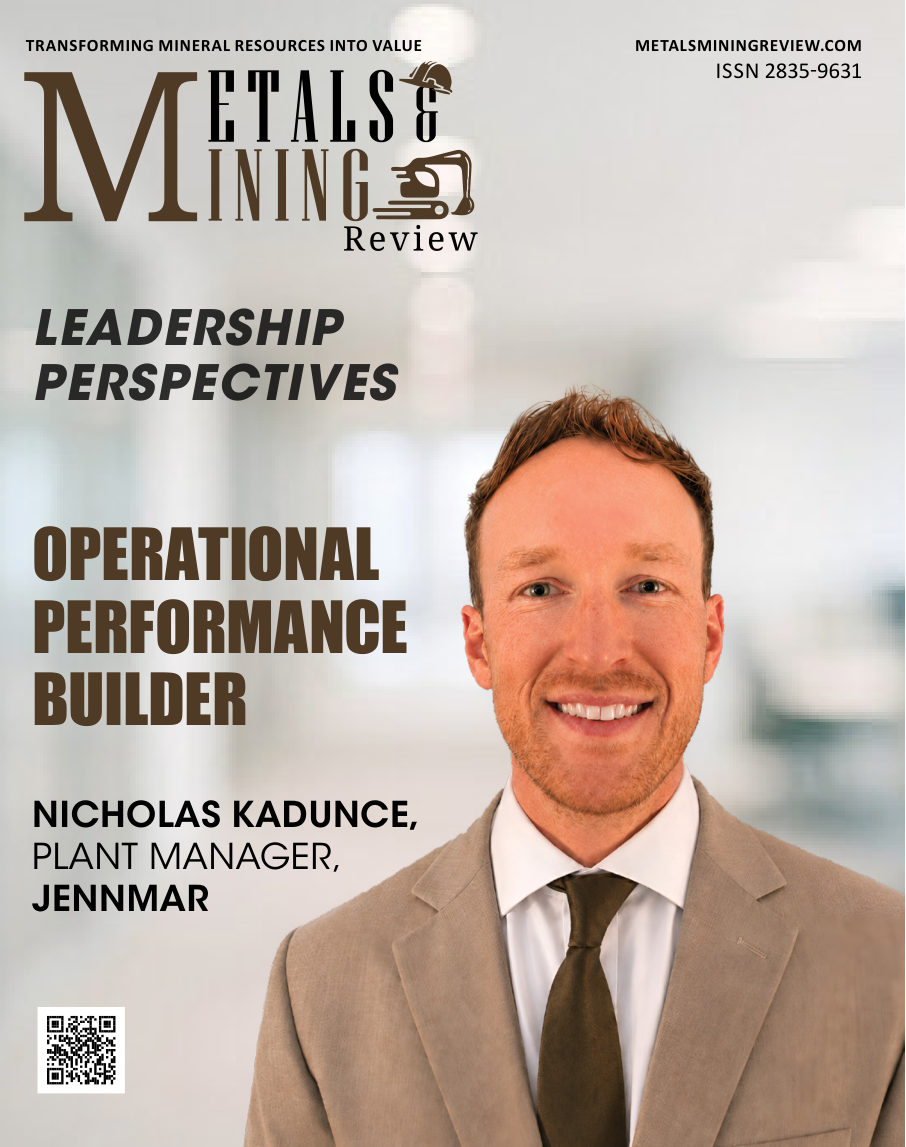
Plant Manager · Operations Leadership

I build systems that
drive results.

From the plant floor to full P&L ownership in five years. I lead manufacturing operations by building high-performing teams and the operating discipline—real-time visibility, clear priorities, accountable execution—that makes performance repeatable.

The Journey

From the plant floor to the P&L.

Five years, four companies, steadily bigger problems. Every chapter added a discipline—and every discipline still shows up in how I run a plant today.

2020 — 2022
The plant floor
Johnson Matthey · Process Control Engineer → Shift Leader II

I started where operations actually happens—on an automated diesel-catalyst line, fresh out of chemical engineering at West Virginia University. As a process control engineer I learned to read a production line the way a clinician reads vitals: cycle times, defect rates, downtime patterns. Then came my first team—six technicians and a process control engineer—and the harder lesson that results come from people. Together we lifted OEE more than 5% and ran every shift without a single recordable injury.

2022 — 2023
The wider lens
Messer Americas · Regional Production Engineer

One plant became a region. Covering air-separation and specialty-gas facilities across the Northeast, I owned improvement projects, project budgets, and reliability at sites I couldn't walk every day. That forced real discipline: standardized processes, honest metrics, and influence without direct authority. Six Sigma work on Krypton/Xenon production added over $1M in annual revenue, and 15+ reliability projects with the site teams clawed back 25 days of annual downtime.

2023 — 2025
The scale-up
Eos Energy Enterprises · Quality Engineer → Operations Manager

I joined a battery-storage scale-up as a quality engineer and left running manufacturing operations—11 supervisors, 6 team leads, and 240 technicians across two buildings. Together we built the company's first production dashboards, converted subassembly from batch to one-piece flow for a 41% throughput gain, grew BESS output 340%, cut rework 66%, and stood up a brand-new third shift that became the plant's best within a month. Scale-ups don't hand you playbooks—we wrote ours as a team.

2025 — Present
The P&L
Jennmar · Plant Manager

Today I run a high-volume mining-infrastructure plant in West Virginia—accountable for safety, quality, delivery, cost, and a team of about 100 people. Everything the first five years taught me gets applied daily: a management cadence built on real-time data, planned maintenance instead of reactive repair, quality governance with full material traceability, and supervisors coached into leaders. In our first year, the team grew output 36.7%—and we're already working the next constraint.

The pattern has held at every stop: walk the floor, find the constraint, build the system, develop the people—repeat.

Impact

What the teams delivered.

0
Plant Output Growth, Year One
0.5 → 2.2
BESS Units/Day (4.4×)
$1M+
Annual Revenue Added
0
Rework Reduction
0
Days of Annual Downtime Eliminated

How I Operate

Complexity to execution—in six moves.

1
Instrument
Build automated data flow. If it's painful to collect, it won't scale.
2
Surface
Visualize so problems are obvious. If leadership has to dig, the system failed.
3
Prioritize
Rank by impact with Pareto and SPC. Attack the constraint, not the symptom.
4
Control
Eliminate recurrence. Process mapping, control plans, clear ownership—so problems stay solved.
5
Sustain
Build systems that self-correct—flagging issues early and holding gains with minimal oversight through scheduled reviews.
6
Repeat
Cycle continuously. Each pass addresses smaller constraints and higher-order optimization.

The Toolkit

The right tool for the constraint.

Operational excellence isn't one methodology. I've invested in three disciplines—and I reach for whichever one removes the constraint fastest.

01

Lean & Six Sigma

The discipline

  • DMAIC problem-solving to Black Belt depth
  • One-piece flow, takt alignment & Yamazumi balancing
  • 5S, visual management, Kanban & Andon
  • SPC, Pareto & structured root-cause analysis
  • Daily management & supervisor standard work
02

Data & Systems

The visibility

  • Real-time OEE, downtime & quality dashboards
  • Financial forecasting & variance modeling
  • CMMS implementation & planned maintenance
  • Machine-level data capture—16 machines, 2.8M+ sensor records
  • KPI architecture tied to the P&L
03

AI & Automation

The force multiplier

  • Automated daily performance reporting
  • AI-assisted SOP standardization
  • Condition-based maintenance triggers from sensor data
  • Automated SPC & defect trend detection
  • Workflow automation across ERP, CMMS & quality systems

A note on AI: it's a tool in the arsenal—not the arsenal. It earns its place when it removes manual work, sharpens a decision, or scales a proven process. The fundamentals—safety, quality, flow, and people—are never outsourced to a model.

Proof of Work

Systems I've built and run.

Dashboards, monitoring systems, forecasting tools, and improvement projects—this is what operational discipline looks like in practice.

Every visual is a faithful recreation of a system I built, shown with representative data—the production versions run on live plant data, which stays inside the plant.

Operational Tools 7 projects
Operations Daily Dashboard

Interactive daily operations email with real-time KPIs, downtime analysis, quality metrics, and action tracking—sent automatically each morning to plant leadership. Features in-email navigation buttons for mobile-first consumption.

Capital Planning — Annual Portfolio

The annual capital plan, balancing automation investment against care of the asset base—each project scoped, sequenced across the year, and tied to a payback case before submission.

Total planned capex · illustrative · 12 projects$2,085,000
Automated Cell — Line 2
Combine forming and assembly into one robotic cell
Automation Nov
$1,050,000
Packaging Robot — End of Line
Robotic case packing and palletizing
Automation Sep
$240,000
Conveyor Upgrade — Line 3
Replace worn conveyor and add an accumulation buffer
Maintenance May
$180,000
Compressed Air Overhaul
New compressor and dryer, plus leak-down repairs
Infrastructure Aug
$120,000
CNC Spindle Rebuild
Planned rebuild of two high-hour spindles
Maintenance Feb
$95,000
Critical Spares Program
Plant-wide coverage for long-lead components
Maintenance Jul
$85,000
Warehouse Racking Expansion
Add selective racking for finished-goods overflow
Infrastructure Jun
$75,000
Dust Collection Upgrade
Higher-capacity baghouse for the finishing area
EHS Apr
$70,000
LED Lighting Retrofit
Plant-wide high-bay LED conversion
Energy Mar
$50,000
Dock Leveler Replacement
Replace two end-of-life dock levelers
Infrastructure Jan
$45,000
Machine Guarding Program
Bring legacy equipment to current guarding standard
EHS Oct
$40,000
Water Treatment Skid
Closed-loop treatment for quench water
Infrastructure Dec
$35,000
Dock Levelers · $45K
Spindle Rebuild · $95K
LED Retrofit · $50K
Dust Collection · $70K
Conveyor Upgrade · $180K
Racking · $75K
Critical Spares · $85K
Air Overhaul · $120K
Packaging Robot · $240K
Guarding · $40K
Automated Cell · $1.05M
Water Skid · $35K
JanFebMarAprMayJunJulAugSepOctNovDec
Automation Business Case — Current vs. Future State

An illustrative automation business case: two manual steps become one integrated cell—five operators to three per shift, WIP staging and forklift moves between them eliminated, one-piece flow with repeatable cycle times.

CURRENT STATE Raw mtl Step 1 1 op WIP Step 2 1 op WIP Step 3 1 op WIP Step 4 2 ops ELIMINATED WIP · forklift moves Step 5 3 ops Finished FUTURE STATE Automated Cell — Steps 4 + 5 3 operators per shift · robot-direct transfer · one-piece flow
−4
Direct operators — 5 → 3 per shift across a 2-shift operation, redeployed to constraint areas
−1
Indirect operator — forklift moves eliminated, handling workload rebalanced
$420K
Projected annual savings · 30-month payback on a $1.05M investment
Projected Savings & ROI

The financial case behind the same illustrative project—savings built bottom-up from labor and benefits, then tracked against a 36-month payback target.

Projected annual savings
$420,000
recurring · per year
Monthly savings
$35,000
per month
Project investment
$1,050,000
one-time capital
Payback period
30 mo
2.5 years to break-even
Where the $420K / yr comes from
Savings built bottom-up, not asserted
Direct labor$268,800
Indirect labor$67,200
Benefits (25%)$84,000
Five positions come out of the cell—four direct, one indirect—with people redeployed to constraint areas rather than cut adrift.
Production Improvement — Proven in Control

A throughput project told the way it should be—on a control chart. Baseline the process, make the change, then hold a control period to prove the gain is real: average daily output up 15%, day-to-day variation down 10%, and the new level holding inside recalculated control limits.

Avg daily output
+15%
2,600 → 2,990 units/day
Daily variation
−10%
std deviation of daily output
Control period
30 days
new level held in control
Inventory Breakdown — Where the Cash Sits

Value on hand with a Pareto inside each class—finished goods, raw material, and WIP—so the conversation starts where the cash actually sits. Illustrative snapshot: $7.8M held near a healthy mix—roughly half finished goods for service level, a third raw material sized to supplier lead times, and minimal WIP.

Finished Goods$3.90M · 50% Raw Material$2.73M · 35% WIP$1.17M · 15%
Finished goods · $3.90M (50%) Raw material · $2.73M (35%) WIP · $1.17M (15%) —•— cumulative % within class
Monthly Efficiency — Year over Year

Plant efficiency against prior year, with the current year split by shift—trending up year over year, with the two crews running nearly even.

Manufactured Tons — Volume in Context

Volume tells the other half of the efficiency story. In this illustrative year, tons step down through Q2 as volume is rebalanced to a sister plant—while efficiency climbs—so demand is met without overtime or weekend hours. The biweekly hours picture shows what that means for the crew: overtime disappears and schedules return to straight time.

Career

Experience

2025 — Present
Jennmar
Underground Mining & Tunneling Infrastructure
Plant Manager

Leading end-to-end operations for a high-volume manufacturing site—a team of about 100—and building the data systems and operating cadence that make performance predictable and scalable.

  • Own full P&L for a high-volume manufacturing site; in year one the team delivered a 36.7% output increase through operating-cadence redesign and data-driven target setting
  • Built a financial forecasting model that improved operating net income visibility and reduced month-end variance, enabling faster executive decision-making
  • Designed and installed a cross-functional daily management system aligning production, maintenance, quality, and safety—eliminating siloed reporting and accelerating issue resolution
  • Led strategic shift from reactive to planned maintenance through CMMS implementation, reducing unplanned downtime and extending asset life across all critical equipment
  • Developed and coached front-line leadership through structured Supervisor Standard Work, raising accountability, reducing turnover, and building a pipeline for internal promotion
  • Established quality governance framework with automated SPC, material traceability, and quarantine controls—strengthening customer confidence and reducing cost of poor quality
  • Digitized plant operations end-to-end—real-time machine monitoring with automated OEE and downtime analytics across 16 machines, plus automated daily performance reporting—so leaders act on data instead of assembling it
Team: ~100 people across production, maintenance, quality & shipping
2023 — 2025
Eos Energy Enterprises
Battery Energy Storage Systems
Operations Manager

Together with 17 front-line leaders, turned fragmented operations into data-driven, flow-oriented manufacturing—scaling output while cutting losses.

  • Launched the company's first production dashboards with OEE, automated gap analysis, and KPI charts for real-time clarity
  • Shifted subassembly to one-piece flow, increasing throughput 41% and cutting defects 22%
  • Reduced downtime by 36% through structured Pareto analysis and mitigation plans
  • Implemented visual systems (Kanban, Andon) that exposed problems instantly and accelerated response
  • Grew BESS output from 0.5 to 2.2 units/day by balancing workload with Yamazumi and takt alignment
  • Cut rework 66% by driving data capture, analysis, and targeted process improvement
  • Built a new third-shift team into the highest-performing shift within one month
Team: 11 Production Supervisors, 6 Team Leads, 240 Technicians
Quality Engineer

Built the quality backbone that enabled next-generation products—faster testing, fewer defects, and ISO-anchored compliance.

  • Built comprehensive quality systems for new product families, including controls and test protocols
  • Reduced testing cycles by ~60% with a high-efficiency routine that boosted throughput
  • Developed a dynamic Quality Dashboard for visual metrics and rapid decision support
  • Led internal ISO 9001 compliance activities and structured audit programs
  • Cut scrap defects 30% with targeted initiatives backed by real data
  • Eliminated documentation risk by automating quality record-keeping
Team: 6 Quality Technicians
2022 — 2023
Messer Americas
Industrial Gases
Regional Production Engineer

Drove operational excellence across multiple facilities by scaling visibility, reliability, and process discipline.

  • Led Lean Six Sigma initiatives that increased specialty gas production 15%, adding over $1M in revenue
  • Delivered 15+ improvement projects, cutting downtime by 25 days annually
  • Standardized processes across sites to reduce lead times by ~30 days
  • Guided budget oversight and risk mitigation to align spending with strategic goals
  • Applied controls, instrumentation, and safety expertise to solve complex reliability challenges
2020 — 2022
Johnson Matthey
Clean Air Division
Shift Leader II

Drove shift-level performance and safety excellence by empowering teams with lean discipline and data clarity.

  • Led a team of six technicians and a process control engineer to a >5% OEE gain with zero recordable injuries
  • Integrated lean problem-solving into daily routines, improving flow and safety consistency
  • Cultivated a performance culture grounded in accountability, development, and continuous improvement
Process Control Engineer

Where the fundamentals took root—optimizing automated processes, cutting losses, and learning from the technicians who ran the line.

  • Reduced cycle time 8% and defects 4% through targeted process optimization
  • Designed a risk management tool that cut downtime 8 minutes per work order
  • Strengthened collaboration across functions, eliminating 35+ hours of annual downtime
  • Mentored technicians and fostered a data-driven culture for continuous improvement

Credentials

Certifications & Education

Lean Six Sigma Black Belt
Six Sigma Global Institute (SSGI)
Lean Six Sigma Green Belt
Messer Americas
ISO 9001 Lead Auditor
Exemplar Global
Certified ScrumMaster
Scrum Alliance

B.S. Chemical Engineering · West Virginia University, 2020

Connect

Let's talk.

Open to conversations about operations leadership, manufacturing performance, and what it takes to build teams and systems that deliver.

Ask about Nicholas
Hi — I'm a small assistant trained on Nicholas's background. Ask how his teams delivered results, what the path from the plant floor to plant manager looked like, or how he runs operations today.