
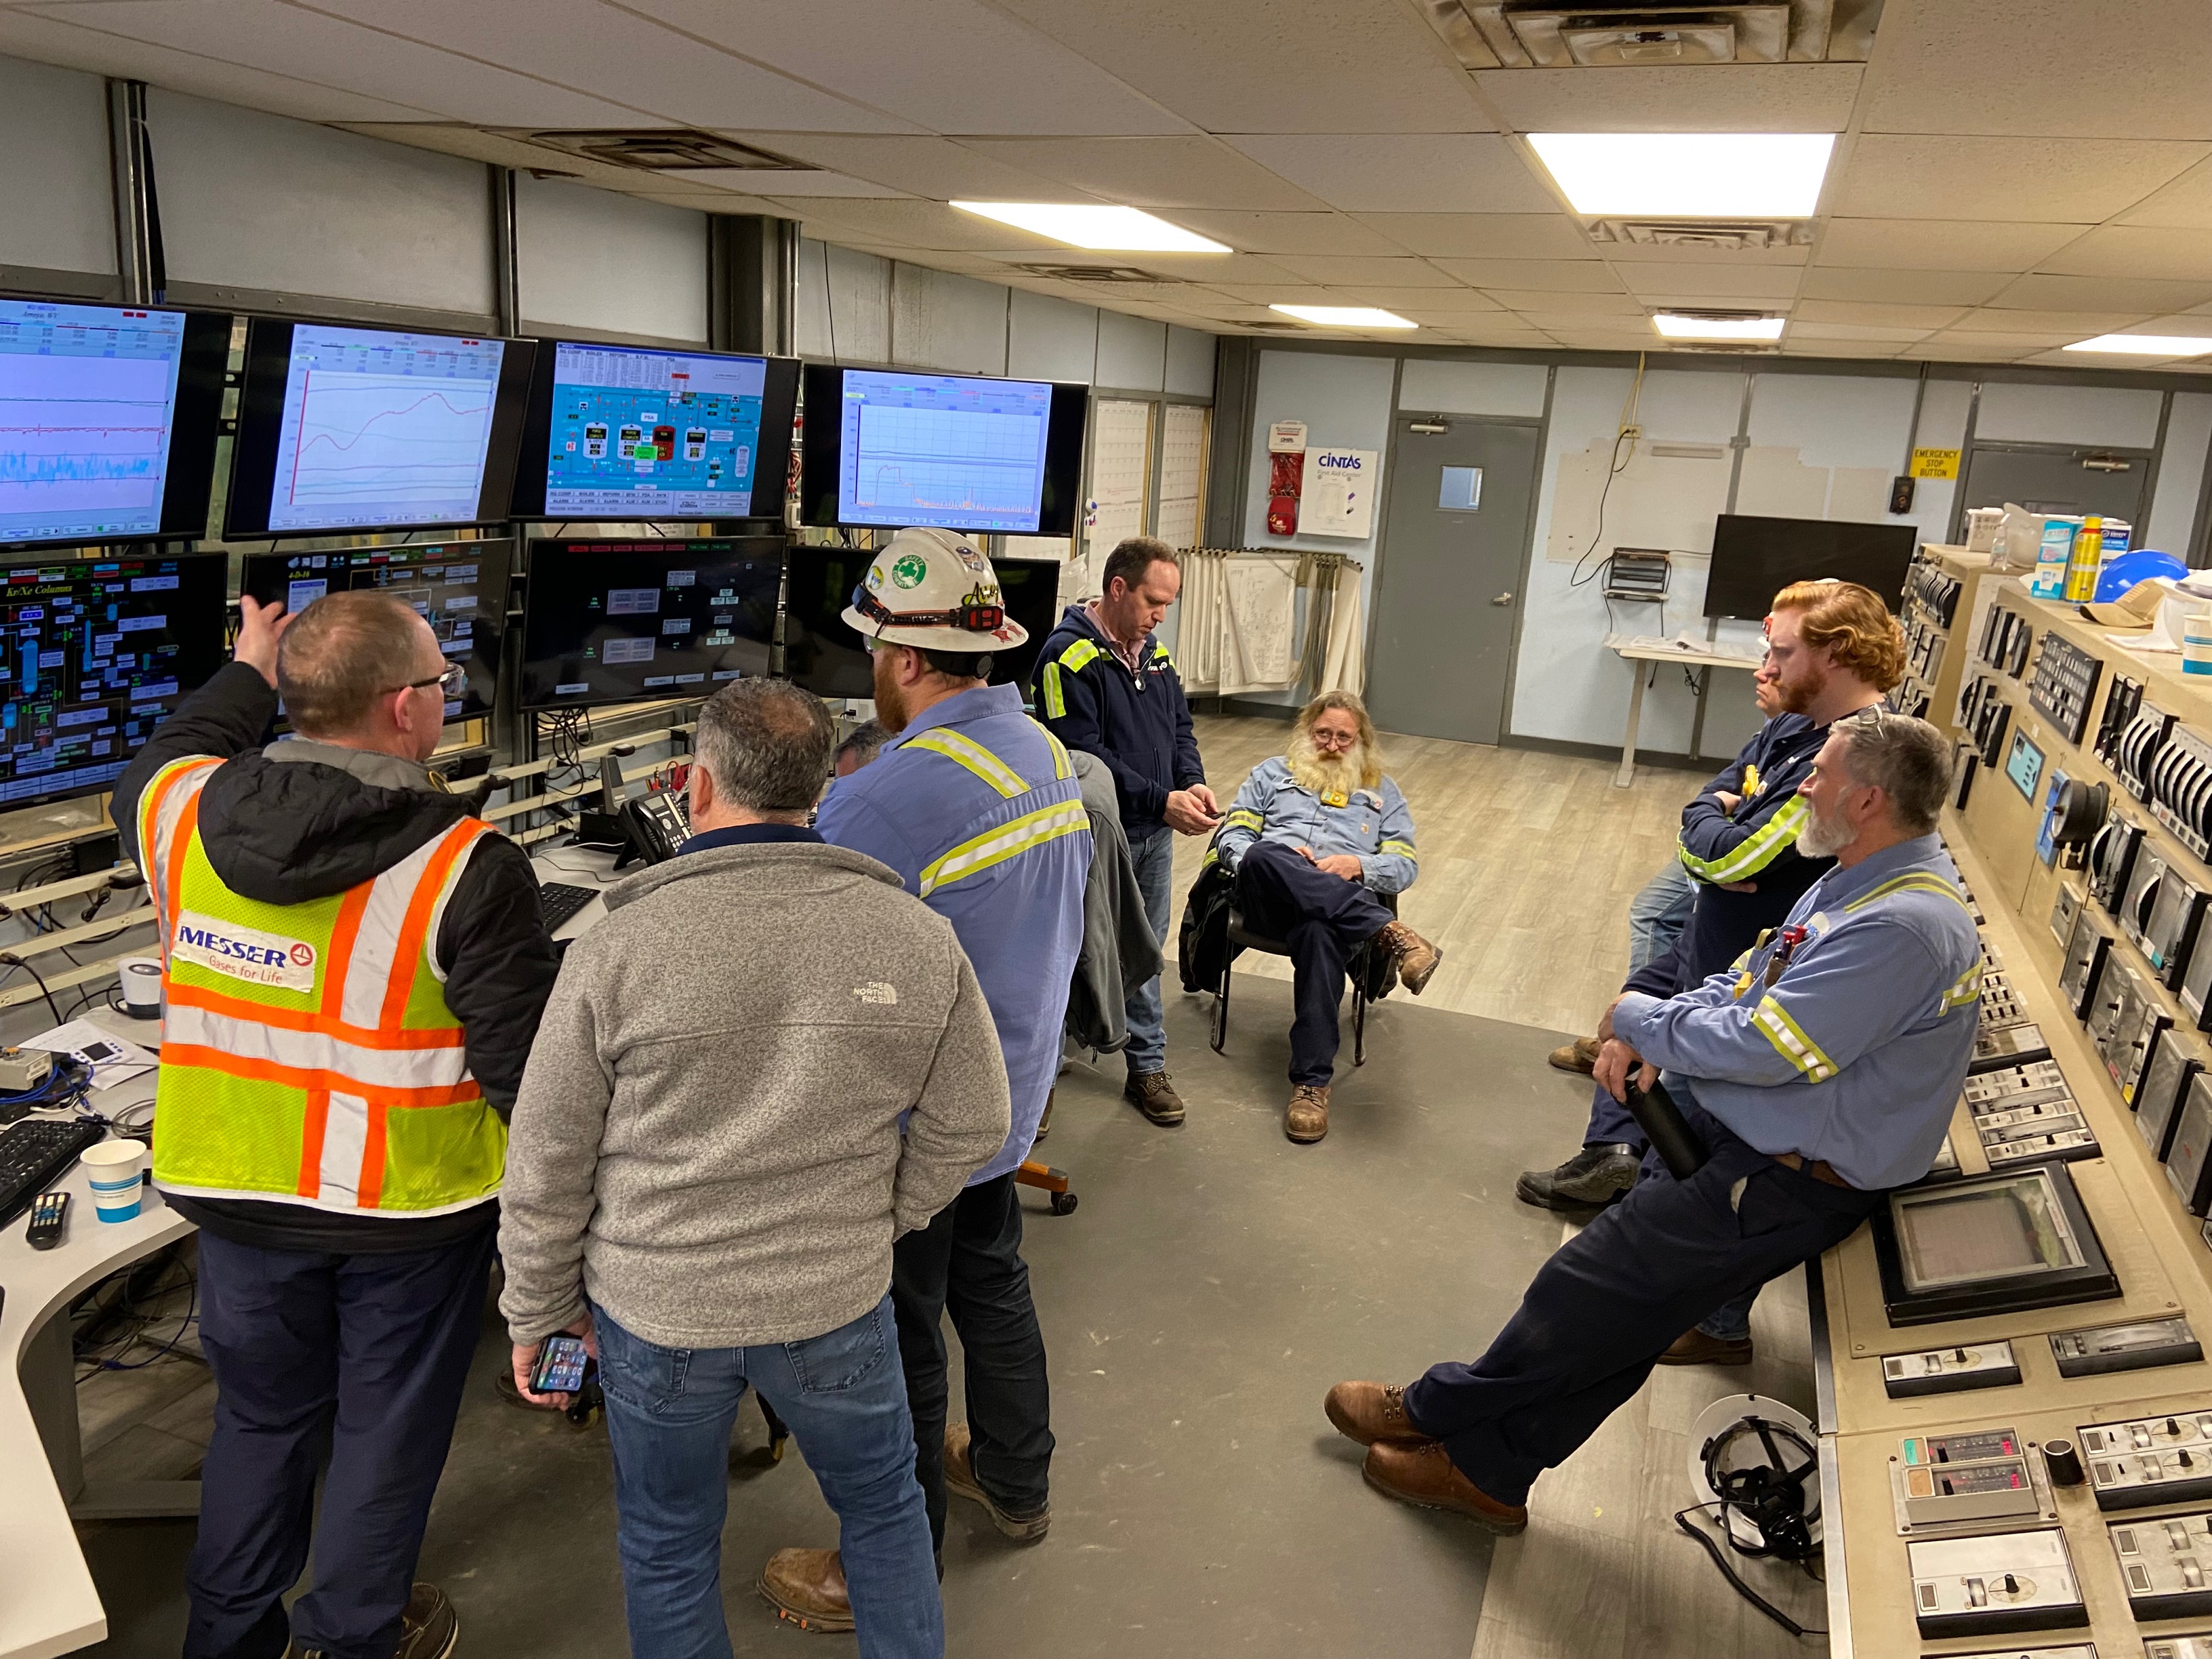
Operations Daily Dashboard
Interactive daily operations email with real-time KPIs, downtime analysis, quality metrics, and action tracking—sent automatically each morning.
In the live email, clicking the Maintenance chart opens an interactive drilldown view. Try it below:
Daily Operations Dashboard
Real-time visibility into production, safety, quality, and maintenance metrics—built for morning stand-ups and executive review.
Downtime Analysis
Hour-by-hour Pareto analysis of production losses, categorized by root cause for targeted improvement.
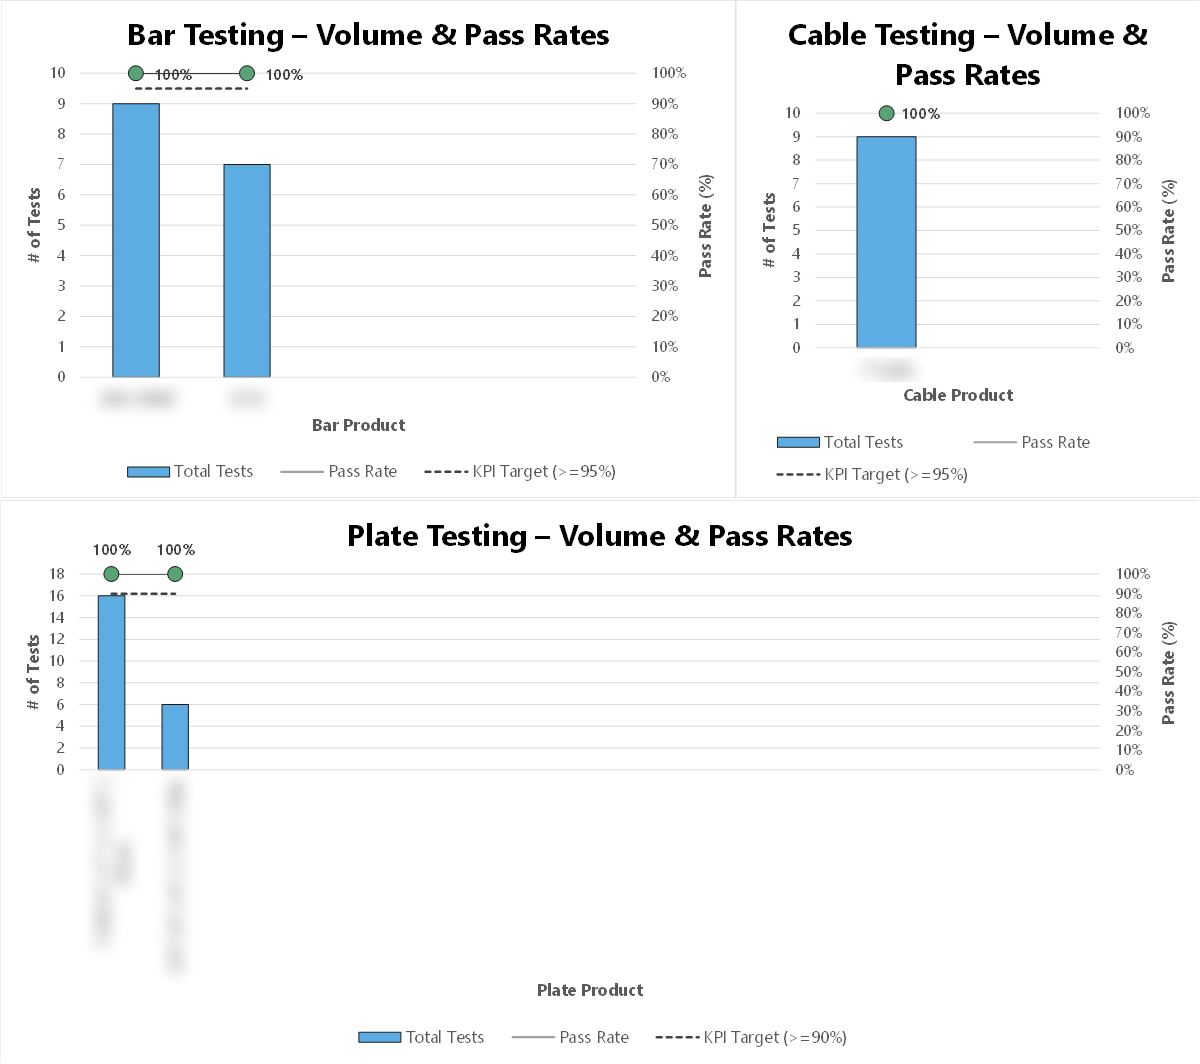
Quality Metrics
Defect rates, rework tracking, and quality trends across production lines.
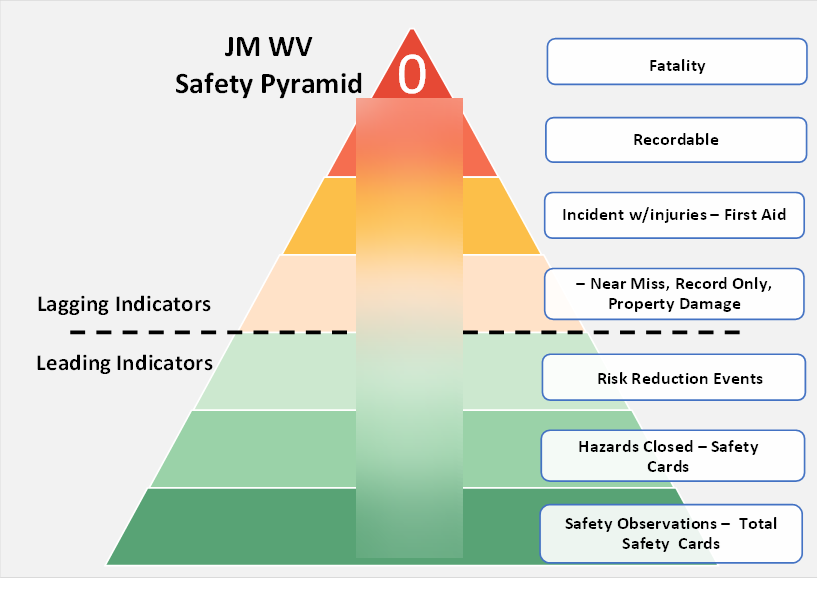
Safety Dashboard
Incident tracking, near-miss reports, and safety observation trends.
Maintenance Tracker
Work order status, PM completion rates, and equipment reliability metrics.
Financial Forecaster
Forecasting tool integrating market data with production capacity for optimized scheduling.
Action Items
Tracked issues and follow-up items with ownership and due dates.
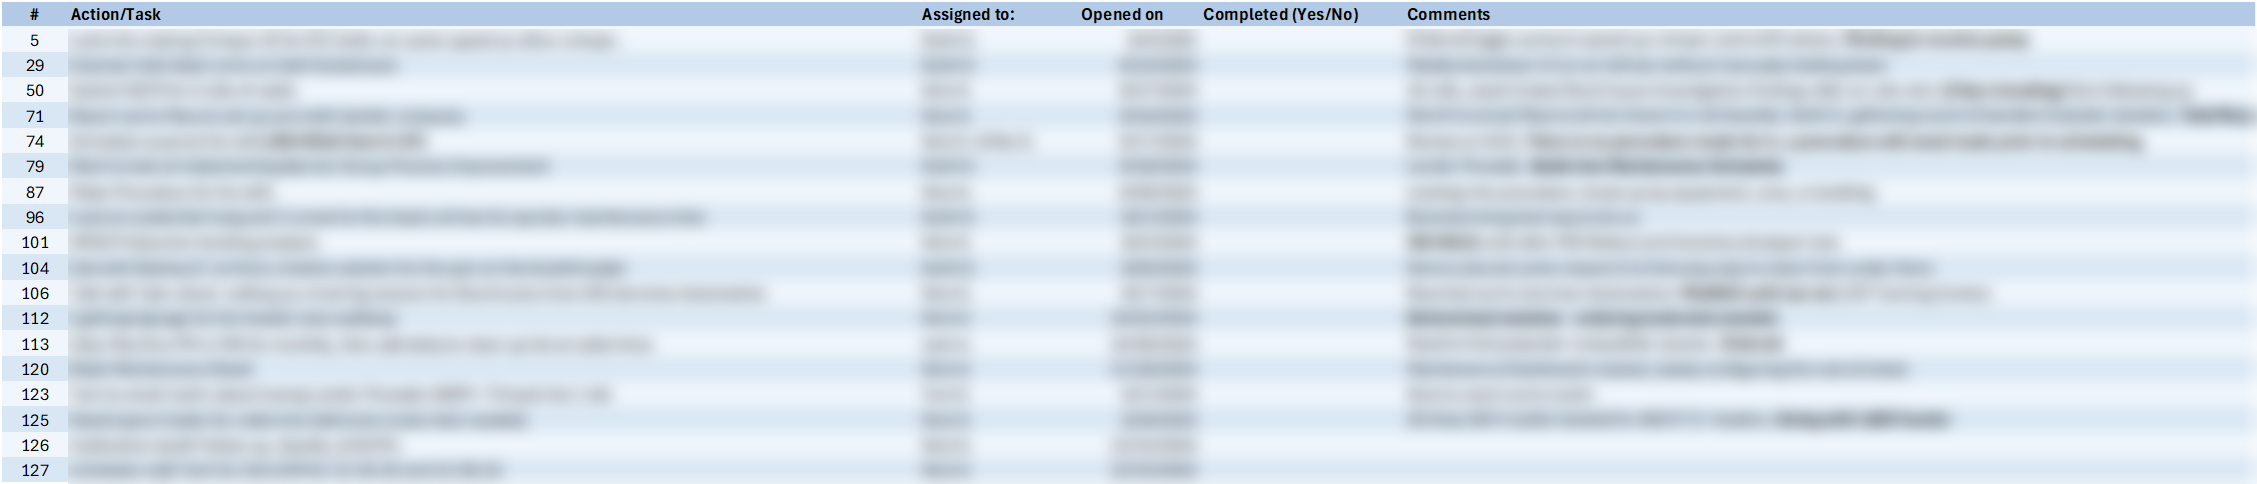
This interactive demo mirrors the automated daily email sent to plant leadership each morning.
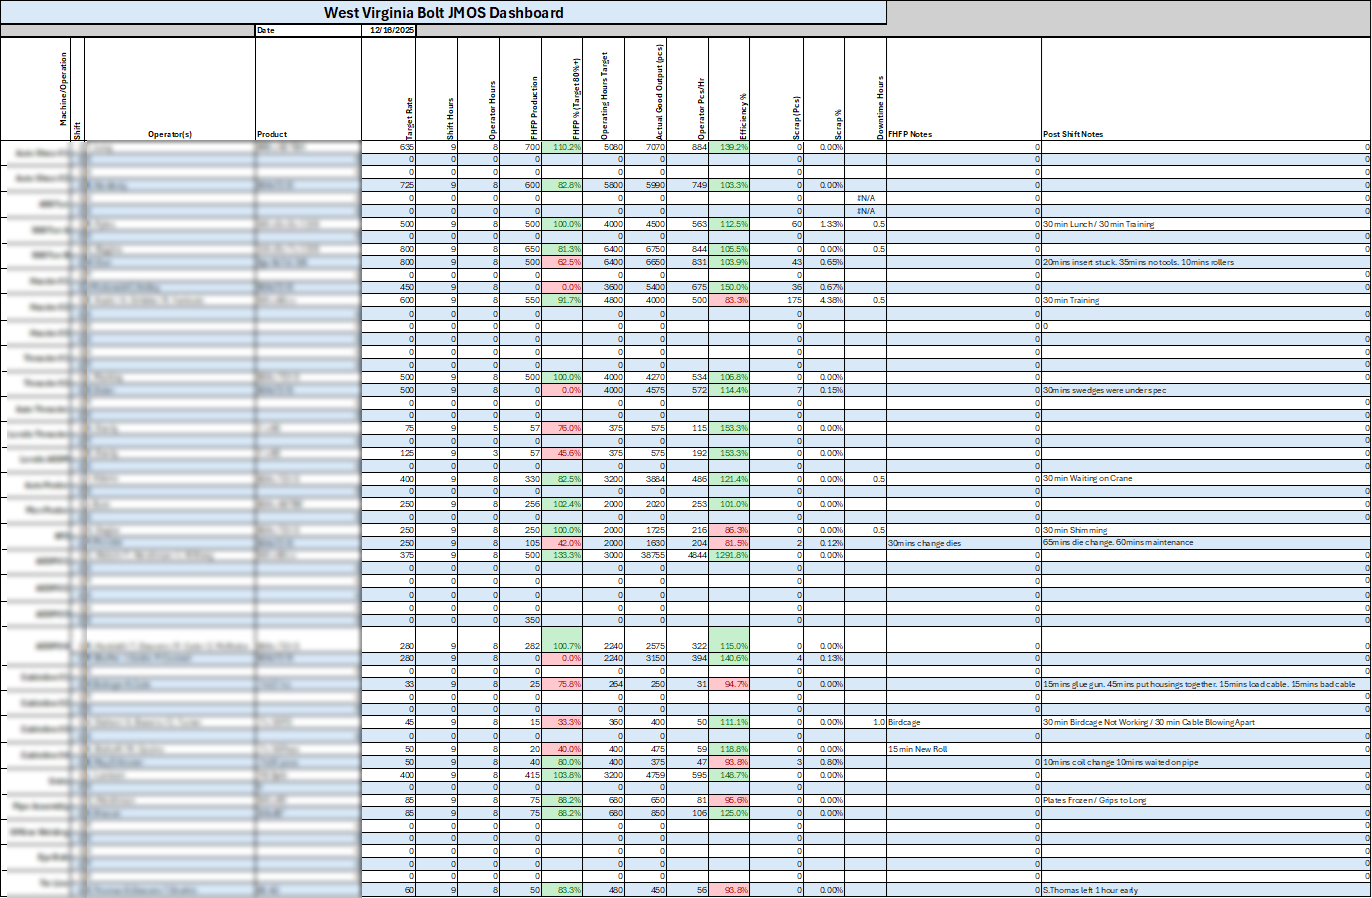
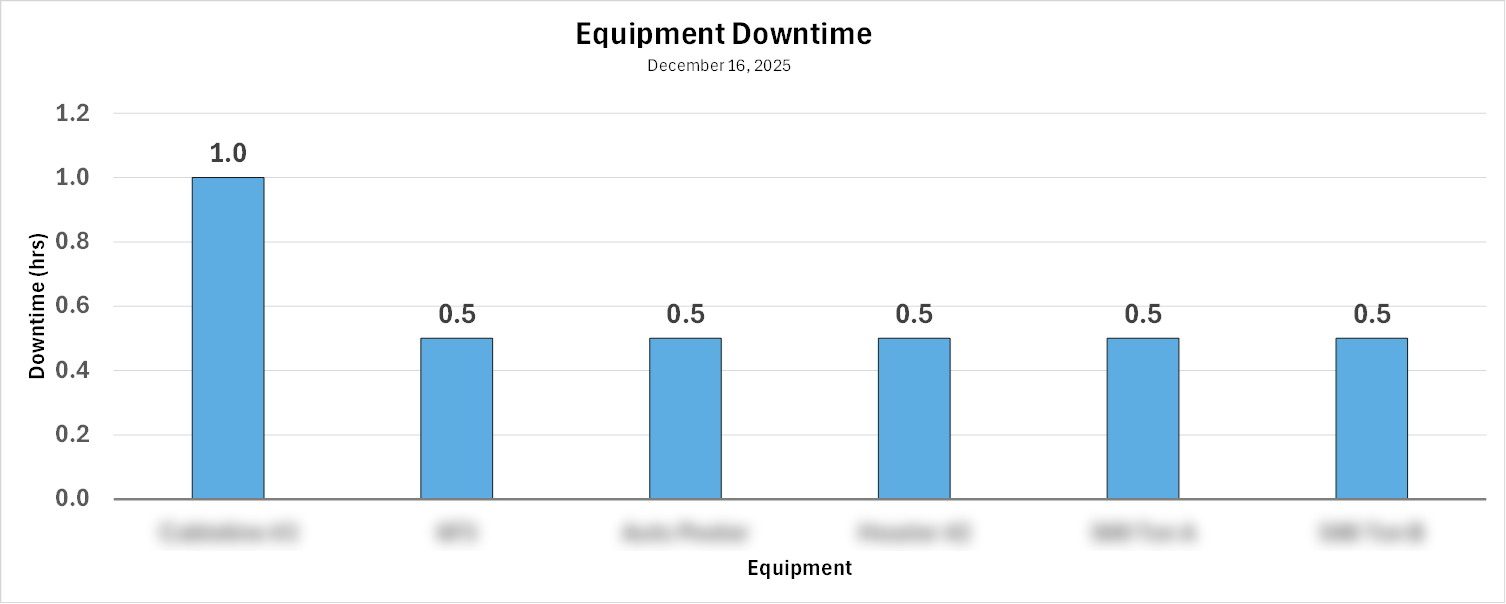
Hour-by-Hour Production Tracking
Shop-floor performance tracking system replacing next-day reporting with hourly visibility—automating calculations, graphs, KPIs, OEE, and employee performance scoring.
Hour-by-Hour Production Tracking
Hour-by-Hour Production Tracking is a shop-floor performance tracking system designed to replace next-day (24‑hour delayed) production and scrap reporting with hourly visibility—without the capital investment required for PLC-driven automation. Team leads record hourly output by station and quickly classify scrap and downtime using standardized defect and downtime codes. Once entered, the tool automates all downstream reporting, including calculations, graphs, hour-by-hour performance boards, gap analysis, KPIs, OEE, and raw material scrap tracking, and integrates with the quality dashboard to strengthen defect monitoring and trend identification. The system was later expanded to compile daily performance and scrap trends by employee and generate "Employee Scores" to support recognition of top performers, targeted training, and consistent performance management.
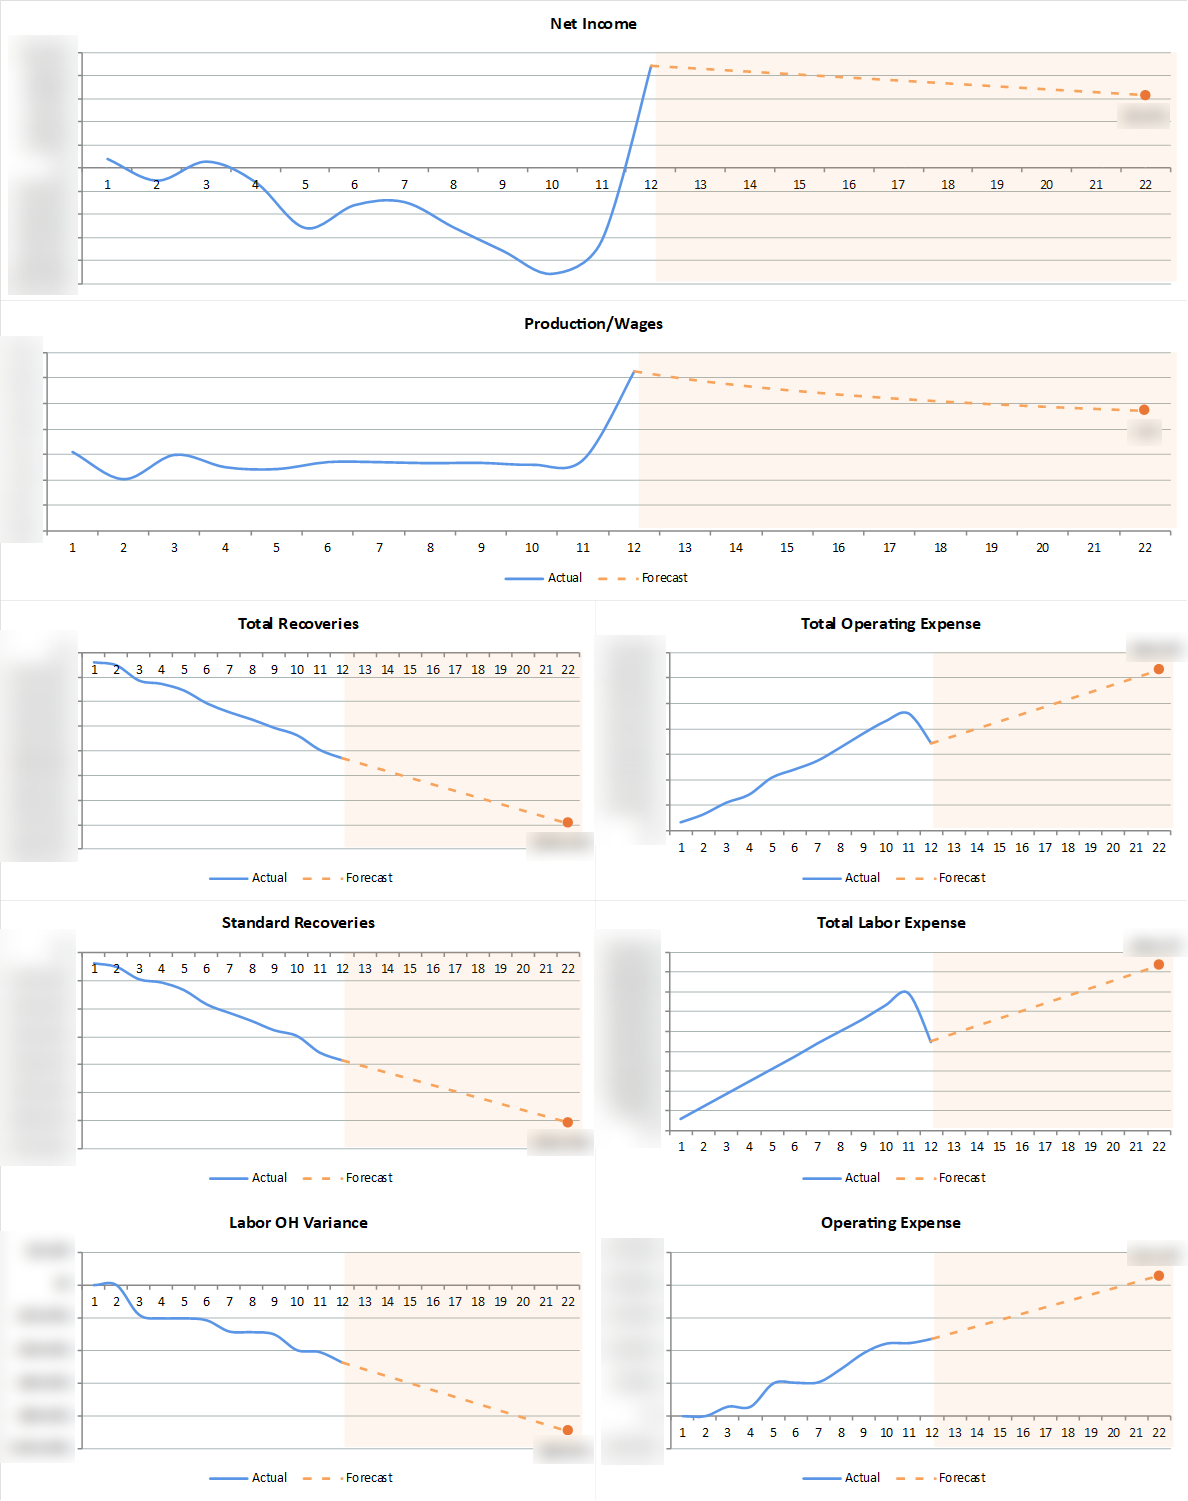
Financial Forecaster
Data-driven forecasting tool using 3-month rolling averages to generate daily financial projections, strengthening performance and improving oversight efficiency.
Financial Forecaster
Financial Forecaster is a data-driven forecasting tool that uses 3-month rolling averages to generate daily financial projections from the most recent actuals. It streamlines consolidation and analysis to strengthen financial performance and improve the efficiency of financial oversight, with planned enhancements including seasonal weighting and advanced statistical methods as more historical data is collected.
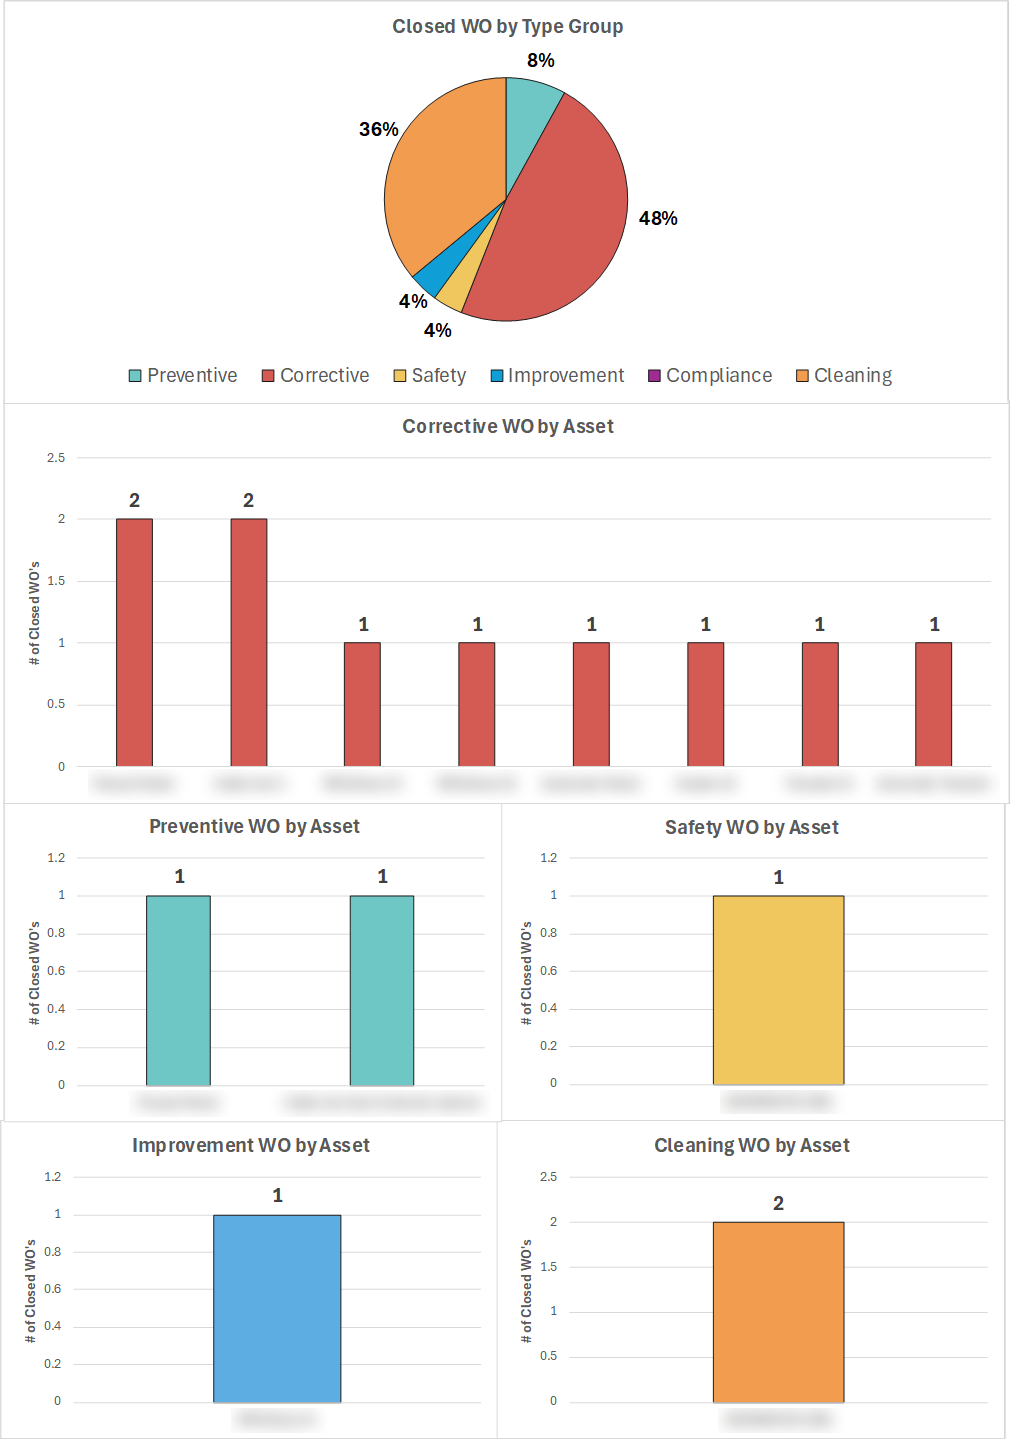
Maintenance Dashboard
Asset-level analytics tracking work order volume and labor hours by maintenance type, optimizing technician utilization and reducing non-value-added effort.
Maintenance Dashboard
Maintenance Dashboard is an asset-level analytics dashboard that tracks work order (WO) volume and labor hours by maintenance type, providing clear visibility into which assets generate the most activity and consume the most time. It helps identify equipment and maintenance trends to improve asset availability, optimize technician utilization, and reduce non–value-added maintenance effort.
.PNG)